Private equity portfolio analytics worksheet
- Gross multiple on cost, whole portfolio
- 1.78
- Computed on this page from the inputs below
- Realised multiple on cost
- 2.5
- Computed on this page from the inputs below
- Unrealised multiple on cost
- 1.57
- Computed on this page from the inputs below
- Unrealised share of total value, percent
- 68.75
- Computed on this page from the inputs below
Every figure on this page is computed from the inputs entered, by the method stated below it. LPreportly publishes no valuation, no benchmark multiple, no target growth rate and no loss ratio of its own: the marks, the KPIs and the ownership are your fund's own figures.
Email me this result
We will send you these figures and a link back to them. One email, nothing else unless you tick the box.
The figures above start from a worked example (1.78), a fund's own numbers rather than anybody's benchmark. Change any input and the answer updates as you type.
Download the Private equity portfolio analytics worksheet worked example (CSV)
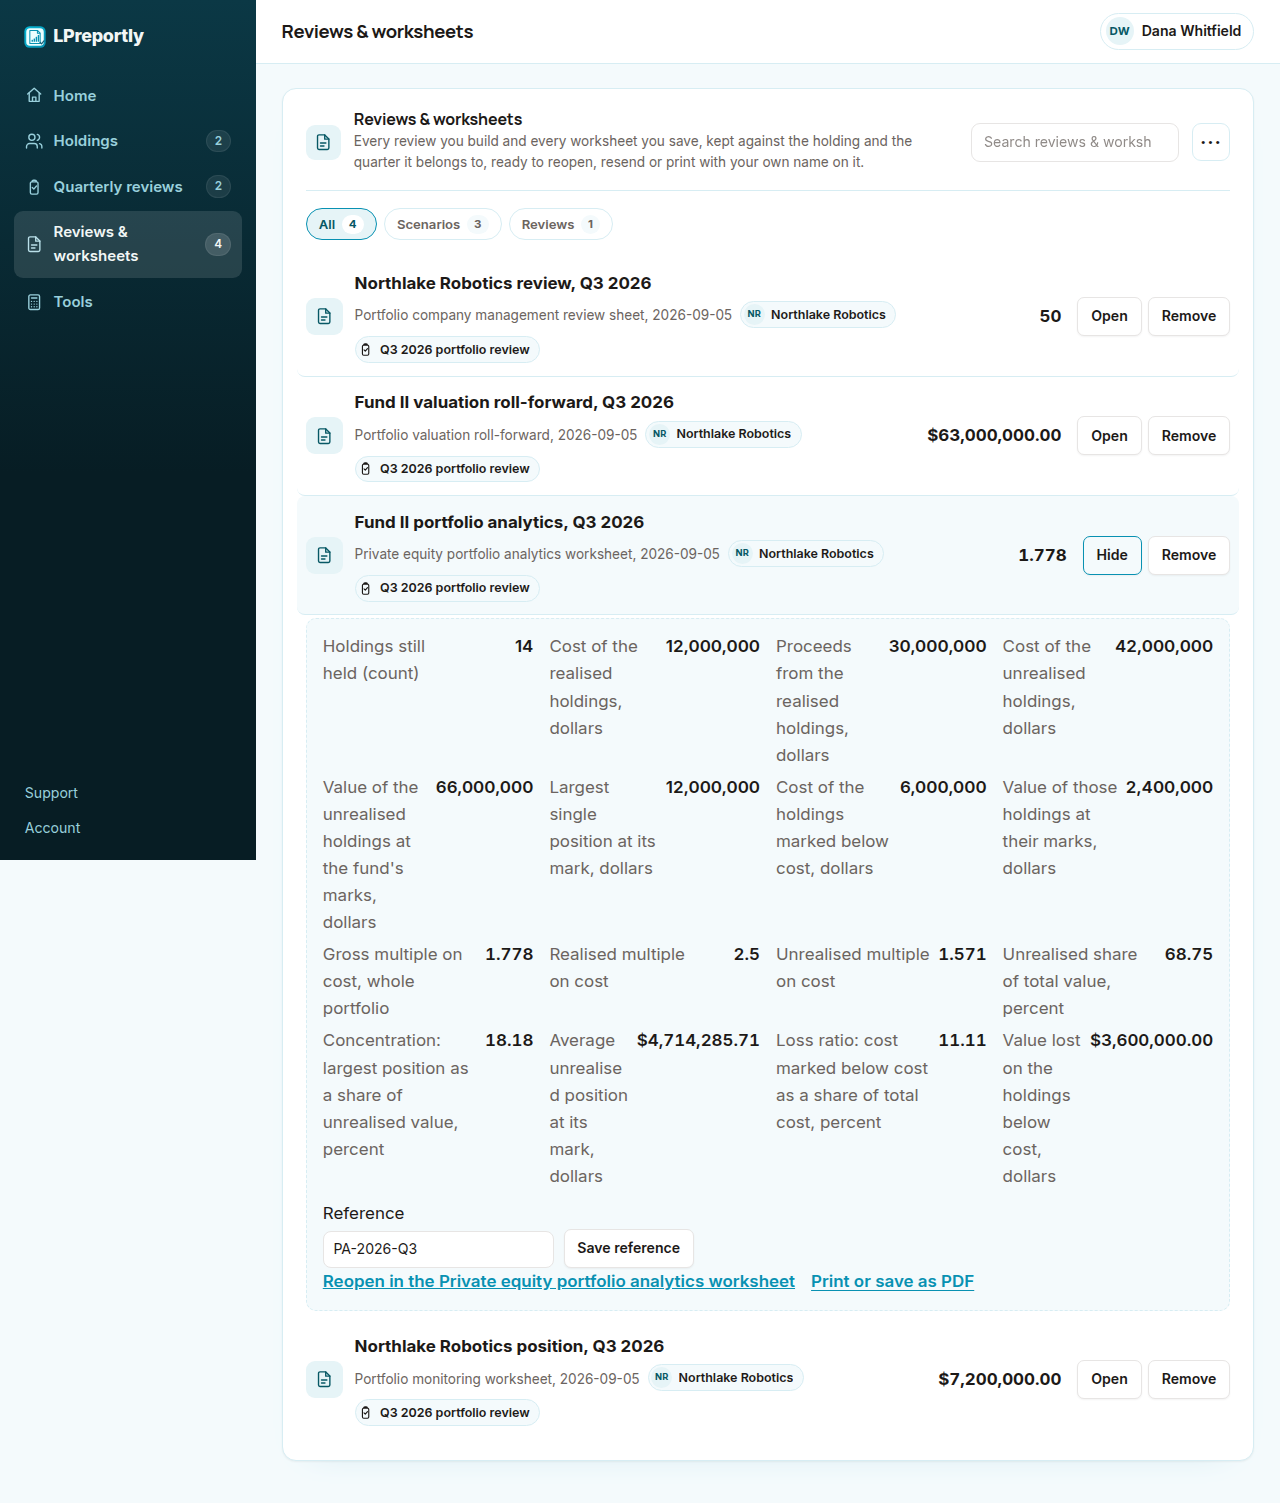
This is a private equity portfolio analytics worksheet that works the portfolio's figures from the fund's own realised and unrealised holdings. Proceeds plus the unrealised marks over total cost is the gross multiple; proceeds over the cost of what was sold is the realised multiple; marks over the cost of what is held is the unrealised multiple; marks over total value is the unrealised share; the largest position over the marks is the concentration; the cost of the holdings marked below cost over total cost is the loss ratio. Every input is yours, the marks are your marks, and the worksheet publishes no benchmark for any of them. Free, on the page, no account; the paid plan works the analytics from the holdings record.
Gross, realised and unrealised
$30,000,000 realised on $12,000,000 of cost is 2.5x; $66,000,000 of marks on $42,000,000 is 1.57x; together, $96,000,000 on $54,000,000 is 1.78x gross. The three read differently on purpose: the realised figure is cash, the unrealised figure is the fund's marks, and the gross figure is the one that hides the difference.
How much is still on paper
$66,000,000 of $96,000,000 is 68.75% unrealised. A young fund reads high here and an old one low, and neither is a verdict; the worksheet shows the share so the review says which part of the multiple is cash and which is a mark.
Concentration and the loss ratio
A $12,000,000 largest position is 18.2% of the unrealised value, and $6,000,000 of cost marked at $2,400,000 is an 11.1% loss ratio on $54,000,000 of cost with $3,600,000 of value lost. Two figures the partners' meeting asks for by name, worked from four inputs and published against no benchmark.
Where the constants in this tool come from
ILPA Reporting Template definitions.
ILPA Reporting Template (v. 2.0), Institutional Limited Partners Association.
Private equity portfolio analytics worksheet: what portfolio teams ask
What is a gross multiple on cost for a portfolio?
Realised proceeds plus the unrealised marks, divided by the total cost of realised and unrealised holdings: $96,000,000 over $54,000,000 is 1.78x on the worked example. It is worked on cost, before fees, and is the deal-level view.
How is the loss ratio worked?
The cost of the holdings marked below cost, divided by the total cost of the portfolio: $6,000,000 over $54,000,000 is 11.1% on the worked example. The worksheet also shows the value lost on those holdings, $3,600,000.
Does this worksheet value the holdings?
No. Every mark is the fund's own input; the worksheet works the ratios between cost, proceeds and marks and publishes no valuation method and no benchmark multiple.