Portfolio monitoring worksheet
- Position value at the fund's mark, dollars
- $7,200,000
- Computed on this page from the inputs below
- Unrealised gain on the position, dollars
- $3,200,000
- Computed on this page from the inputs below
- Gross multiple on cost for this holding
- 1.8
- Computed on this page from the inputs below
- Share of the fund's NAV, percent
- 11.43
- Computed on this page from the inputs below
Every figure on this page is computed from the inputs entered, by the method stated below it. LPreportly publishes no valuation, no benchmark multiple, no target growth rate and no loss ratio of its own: the marks, the KPIs and the ownership are your fund's own figures.
Email me this result
We will send you these figures and a link back to them. One email, nothing else unless you tick the box.
The figures above start from a worked example ($7,200,000), a fund's own numbers rather than anybody's benchmark. Change any input and the answer updates as you type.
Download the Portfolio monitoring worksheet worked example (CSV)
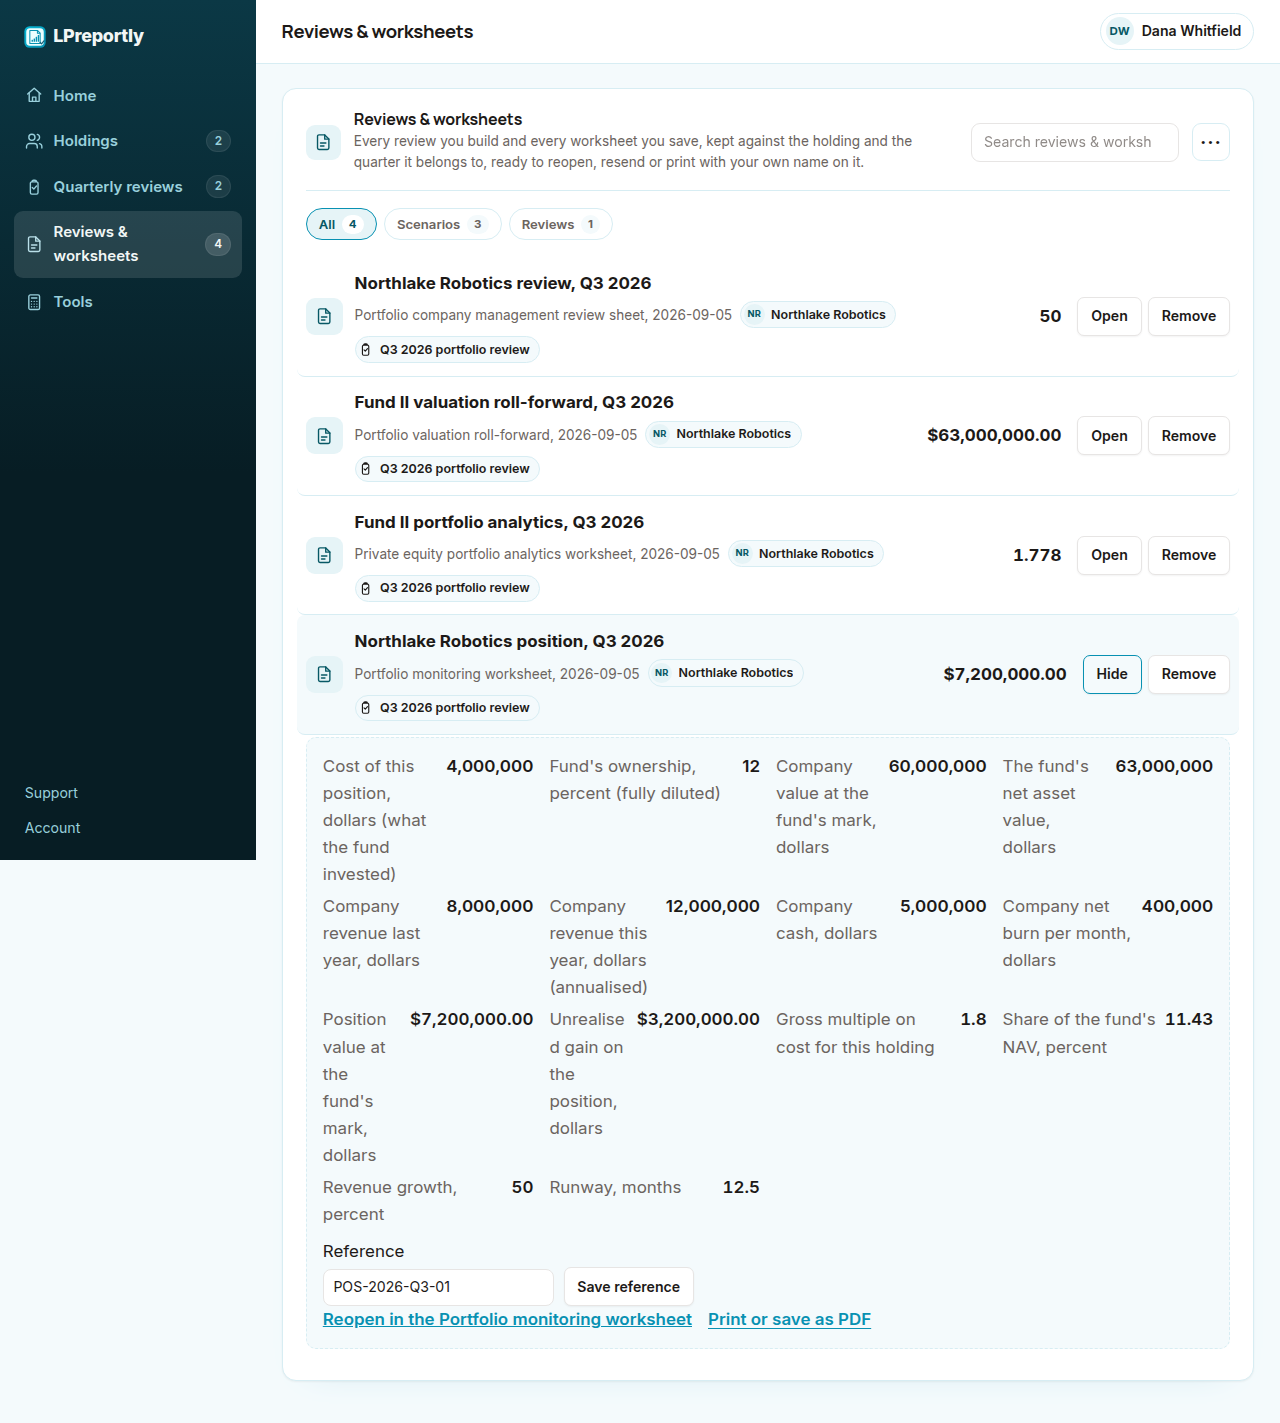
This is a portfolio monitoring worksheet that works one holding from the fund's own figures. The fund's ownership times the company's value at the fund's mark is the position's value; less cost is the unrealised gain; over cost is the gross multiple; over the fund's net asset value is the position's share of the fund; and the company's revenue this year against last and its cash against its burn give the growth and the runway the review reads. Every input is the fund's own, the mark is your mark, and the worksheet publishes no valuation and no benchmark, and the answer is on the page free with no account. The paid plan saves every worksheet against the holding and works the position from the record instead.
The position at the mark
12% of a company marked at $60,000,000 is a $7,200,000 position; on $4,000,000 of cost that is a $3,200,000 unrealised gain and 1.8x. The mark is the last priced round or the fund's own policy, and the worksheet takes it as given: change the mark and the position moves, which is exactly the sensitivity the review should show.
The share of the fund
$7,200,000 in a $63,000,000 fund is 11.4% of NAV. One figure per holding, and the largest of them is the concentration the partners ask about; the private equity portfolio analytics worksheet works it across the whole book from your realised and unrealised totals.
The company's own numbers: growth and runway
Revenue from $8,000,000 to $12,000,000 is 50% growth; $5,000,000 of cash at $400,000 of monthly burn is 12.5 months of runway. Two KPIs the company reported, worked into the two sentences every review opens with, and filed by quarter in the paid plan so the trend exists next time.
Where the constants in this tool come from
ILPA Reporting Template definitions.
ILPA Reporting Template (v. 2.0), Institutional Limited Partners Association.
Portfolio monitoring worksheet: what portfolio teams ask
How is a position's value worked?
The fund's fully diluted ownership times the company's value at the fund's mark: 12% of $60,000,000 is $7,200,000 on the worked example. The mark is your own input; the worksheet publishes no valuation.
What is the gross multiple on cost?
The position's value at the mark divided by what the fund paid: $7,200,000 over $4,000,000 is 1.8x. It is a paper multiple until the holding is sold, and the analytics worksheet separates realised from unrealised across the book.
Is this free portfolio monitoring worksheet really free?
Yes. Enter the eight figures and it works the value, the gain, the multiple, the share of NAV, the growth and the runway on the page with no account and no card. LPreportly Pro saves every worksheet against the holding and adds your fund's name.